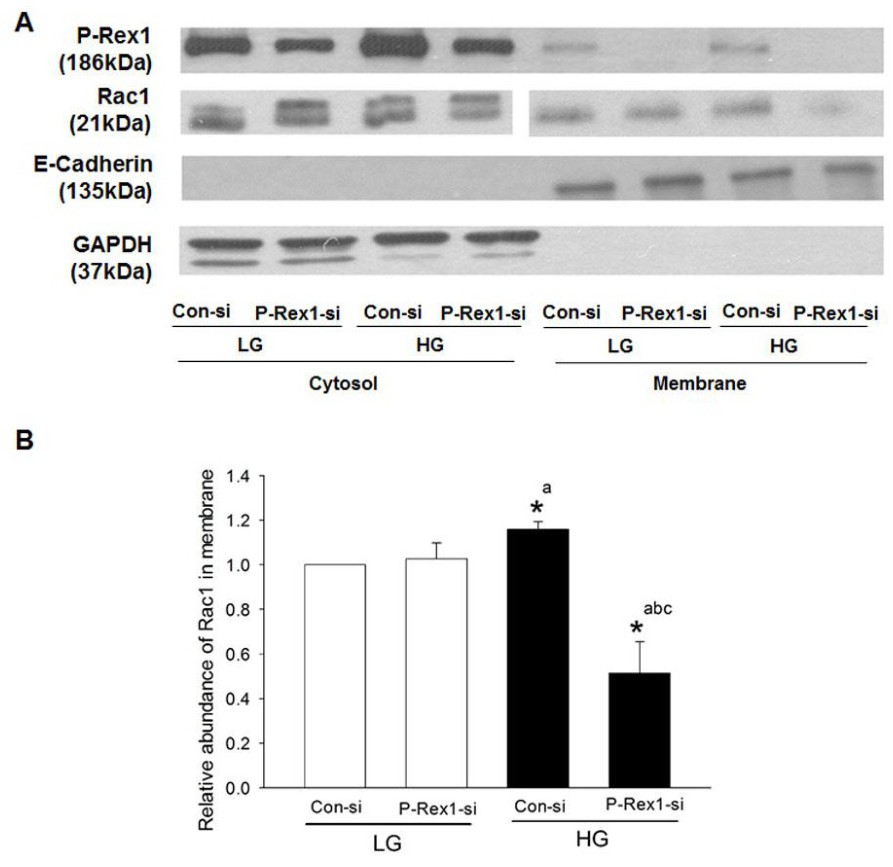
Fig. 3. Depletion of P‐Rex1 suppresses glucose‐induced membrane targeting of Rac1 in INS-1 832/13 cells. Panel A: INS‐1 832/13 cells were transfected with con-si or P-Rex1-si and exposed to either low glucose (LG, 2.5 mM) or high glucose (HG, 20 mM) for 15 minutes. Following incubation, total membrane and cytosolic fractions were isolated using a commercially available kit (see Methods), and relative abundance of P‐Rex1 and Rac1 was determined by Western blotting. Purity of the cytosol and membrane fractions was assessed by expression of GAPDH and E-Cadherin in those fractions, respectively. A representative blot from five independent studies is shown. Panel B: Densitometric analysis of relative abundance of Rac1 in the membrane fraction obtained from studies described in Panel A. Data are expressed as mean ± SD from three experiments. (* p< 0.05) Comparisons shown: a- significant compared with LG Con-si; b- significant compared with LG P-Rex1-si; c- significant compared with HG Con-si.